

You can grow your live streaming audience by improving the quality of your broadcasts, and by analyzing viewership data to improve your viewer's experience. The total number of viewers for your broadcasts is a great statistic to know, but access to in-depth analytics can help you learn more. These numbers give you metrics for reporting and also provide information to help improve your reach and engagement.
With BoxCast's Enhanced Analytics tool, we provide you with robust viewer metrics. This article breaks down the robust statistics provided by the BoxCast Dashboard. 
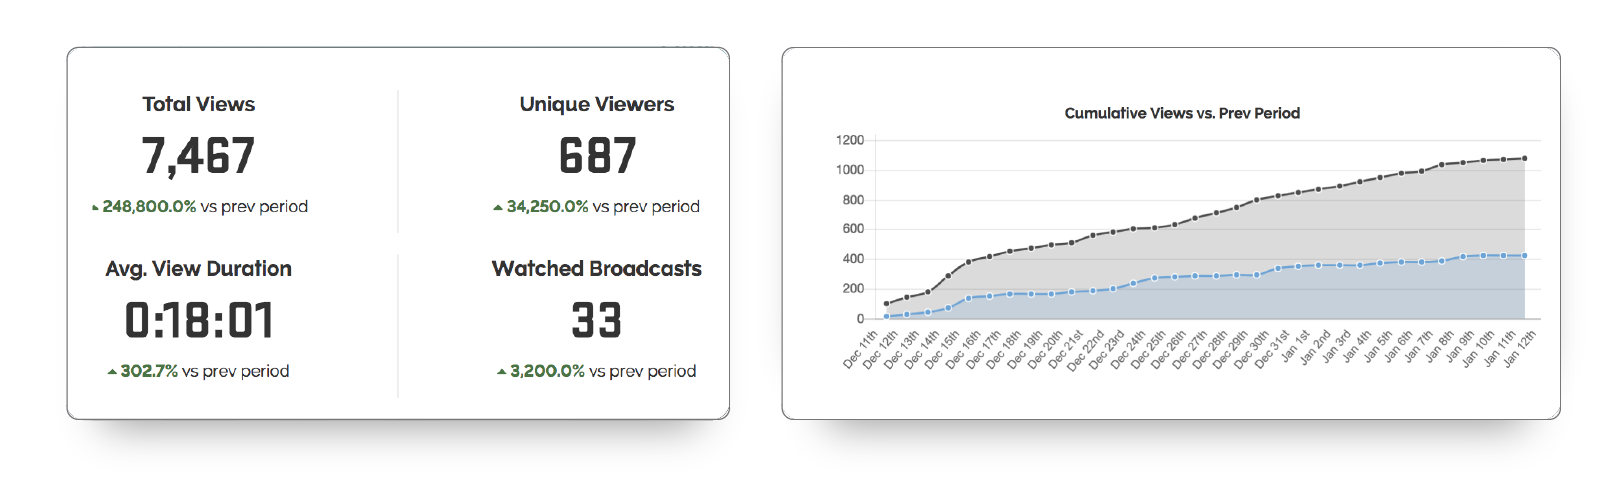
Total Views is a data point familiar to broadcasters in all settings. It gives you a recap of the number of times a set of eyes tuned into a portion of your stream. Total Views is a top-level statistic that can help you figure out your reach.
Unique Viewers shows how many individual viewers watched part of your stream. When comparing this number to the total views, you can see how many people are repeat viewers of the same broadcast. One unique view counts when an individual clicks play on your broadcast from a specific device and internet browser. If they were to refresh that page and click play again, it would count as an additional "total view", but your "unique" viewership would remain the same.
Average View Duration helps you understand how long viewers watch your stream. Typically, the higher your average view duration is, the more engaging your content because it means your viewers are sticking around for the end of the stream.
Watched Broadcasts helps you keep track of how many different streams have been viewed in a certain amount of time. This can be helpful for understanding how long you should store your archived streams.

When Viewers Watch includes two charts that show you the dates and the times when your viewers are tuning in to watch your video. More likely than not, you will see a large circle on the time of day at the time of your live broadcasts, signifying a high online attendance when the stream is on air. However, you may start to pick up patterns that will help you see what times of day your viewers opt to watch the archived videos on their own time.

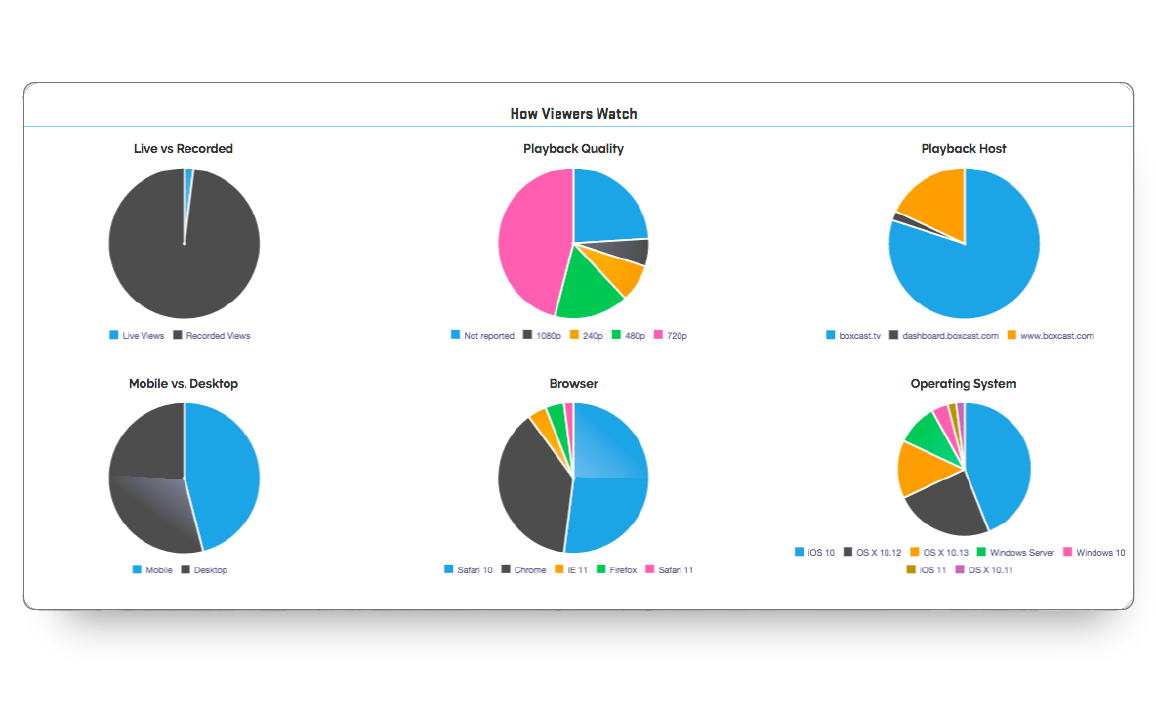
Many of your viewers will want to watch streams live, but others will check on your videos once they are archived. The Live vs. Recorded chart shows the proportion of your viewers watching your content in each way.
If you are streaming in high definition, your viewers who have a good network connection will be able to watch your broadcast in high definition. But what happens if your viewer is watching on their phone in the car?
In the past, they would get annoying buffering, because their phone would not be able to handle the HD stream you are sending out. However, BoxCast uses a technique called Adaptive Bitrate Streaming (ABR). ABR ensures that viewers on many kinds of devices with different capabilities and varying internet access can smoothly play a media stream.
Instead of overwhelming your viewer’s network with a video it won’t be able to play, your viewer will get a smooth video at a lower level.
Playback Quality lets you know how many of your viewers are watching in an environment where they can take advantage of the full picture quality you are sending to them.
If you are streaming to multiple locations hosted by BoxCast (an embedded player on your website, a Roku channel, or an AppleTV channel, etc.), this chart shows which of the streaming locations your viewers are using the most.
These three metrics give further, detailed information into the environment your viewers are using to watch your content.

Geolocation is a great way to track the locations your viewers are watching from. We provide you with an interactive map you can see where in the world your viewers are watching.
Having access to all these great metrics is one thing, but knowing how to improve them is another. If you are trying to figure out how to increase your viewership and viewership duration, we have a few resources that may be helpful to check out. This article will show you five easy ways to get more viewers.
Here are some other resources you might find interesting:
How Many Viewers (Actually) Watched Your Live Stream
How to Add Graphic Overlays to Your Live Stream
How To Upload Documents To Your Live Stream
